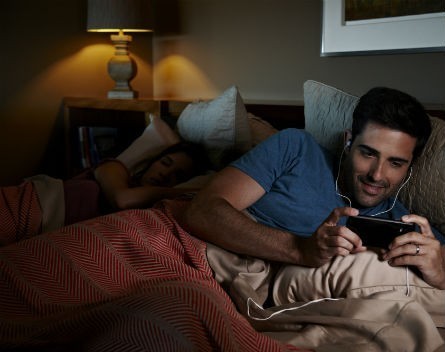
A majority of Australians would rather go without television than their smartphone, while the number of users using their mobile phone for just calls and SMS has fallen to just 9%, according to a new survey.
The Australian Mobile Phone Lifestyle Index was conducted by the Australian Interactive Media Industry Association and conducted by strategic research analysts Complete the Picture.
It combined a survey of 1459 respondents with Australian Bureau of Statistic Census demographic data and socioeconomic status data from the Household Expenditure Survey.
The figures show that 61% of Australians would rather go without television than their mobile phone, while 50% would rather go without their PC or tablet than their mobile. Meanwhile, 30% would rather do without their car than their mobile phone.
Meanwhile, a little over one-third of Australians (34%) have already ditched the landline in favour of just their mobile phone, with a further 48% saying that while they still have a landline connected, they use it rarely.
Another key finding is that growth in the Australian smartphone market is close to a saturation point. Around 89% of Australians now owning a smartphone, up slightly from 88% last year, and up significantly from 67% in 2011.
“The recorded ownership figures will also vary depending on whether it is being measured as a percentage of the overall number of mobile phone subscriptions in Australia (higher than the total number of Australians) or as a percentage of all Australians or just adult Australians,” the report cautions.
The ownership rate for smartphones (88%) are now higher than for either computers (88%) or tablets (60%), with 53% owning all three devices. However, if given the choice between the three devices, 50% would choose their mobile phone, 34% would pick their computer, and just 16% would pick their tablet.
Despite this, when it comes to buying online, many still opt for their desktop or laptop. Around 90% of PC owners have used their computers to make a purchase and 75% of tablet owners have used a tablet to buy a product. In contrast, the percentage of mobile phone users to use their devices to make a purchase is lower, at 60%.
Of those making purchases from their mobile phone, the most common thing to buy is tickets (including movie and plane tickets) at 60%. This is followed by digital content (54%), clothes/shoes/jewellery (41%), books (25%), services (16%), consumer electronics (15%) and groceries (11%).
Finally, the report looked at the controversial topic of whether users prefer mobile websites or apps. It found 7% of users mostly use websites and 28% predominantly use websites.
In contrast, 3% use apps exclusively and 24% prefer to use apps. Around 25% of users use both equally, while 12% opt to use neither.


COMMENTS
SmartCompany is committed to hosting lively discussions. Help us keep the conversation useful, interesting and welcoming. We aim to publish comments quickly in the interest of promoting robust conversation, but we’re a small team and we deploy filters to protect against legal risk. Occasionally your comment may be held up while it is being reviewed, but we’re working as fast as we can to keep the conversation rolling.
The SmartCompany comment section is members-only content. Please subscribe to leave a comment.
The SmartCompany comment section is members-only content. Please login to leave a comment.